Flux Calibration
Standard Stars
The flux and magnitude of the standard stars available in iraf and on ESO are all included in this pakcage. We call these values the template hereafter.
Sensitivity Curve
Note
Sensitivity curves can only be computed if both the standard and observations are wavelength calibrated.
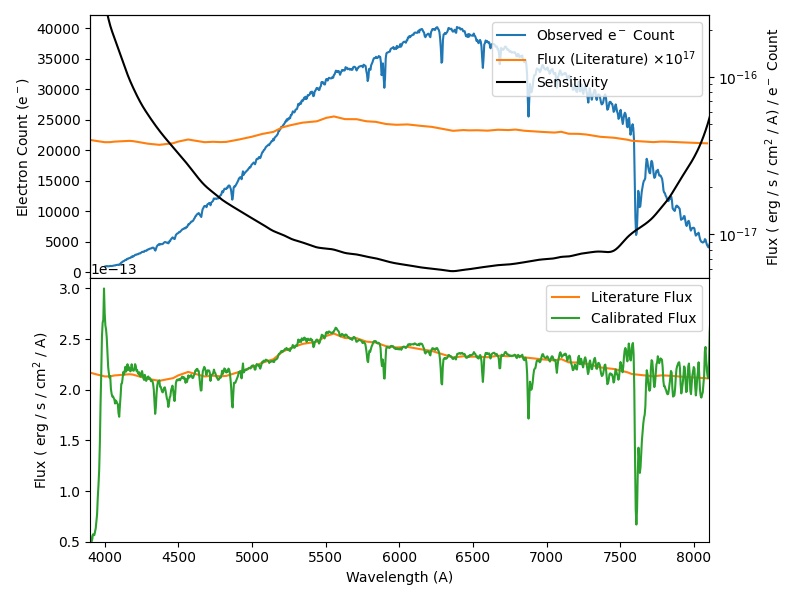
The sensitivity curve is the ratio of the real flux from the standard and the photoelectron count from the observation.
The higher resolution among the template and the observation is resampled to match the lower resolution one.
The template is divided by the continuum (with a lowess function) of the observed spectrum to generate the sensitivity curve which is
then interpolated by the scipy.interpolate.interp1d(). A Satvisky Golay smoothing can be applied before the interpolation.
Masking
Wavelength ranges can be masked when computing the sensitivity curve, for example, over the range of Telluric absorption lines. The deafult masking ranges are 6850-6960, 7575-7700, 8925-9050 and 9265-9750 A. Then, 5 pixel on both side of the maskes will be linearly interpolated to replace the masked values. They will then be replaced by the interpolated cvalues. All these numbers be customised. The telluric mask provided can also be used to derive the telluric profile and then perform the telluric absorption correction.